Have you ever forgotten to change your clocks for Daylight Saving Time? You spend the whole day running behind or ahead—trying to catch up. Collecting EcoMon data in the winter on the Northeast continental shelf helps us set our environmental clocks. Without these data, we spend the rest of the year catching up on what has happened just below the ocean’s surface during winter.
Winter Storms Bring Spring Blooms, Too

During the relative calm of spring, summer, and fall, the ocean waters stratify into distinct layers. Although some mixing of these layers happens during any storm, winter storms tend to be more intense and more frequent.
Strong winter storms mix up even the deepest layers and deliver nutrients from the bottom to upper layers where they are available to support life. Add sunlight, and you get a spring bloom!
Because of this, the water properties that define the rest of the year are determined in winter.
Winter EcoMon was only 6 days long this year. We had two storms that impacted our sampling, including how we got to the ship. However, the days between storms were some of the calmest winter days at sea I’ve ever seen.
The Season Of Change Is Changing

Winter is the season of drastic change, a datapoint we’ve been missing from direct measurements since 2017.
One of the most important missions of the EcoMon project is to record short-term seasonal and long-term decadal changes in the marine ecosystem. The Northeast continental shelf has a large temperature range between seasons with hot summers and cold winters. Historically, February is the coldest month.
However, this area is also one of the fastest warming regions in the world. That warming doesn’t happen equally among seasons. Faster warming in spring and summer means that the timing of winter could shift by a few days or weeks. That means February may not actually be the coldest month for long, and that could mean changes to patterns the rest of the year.
Tracking Ocean Change

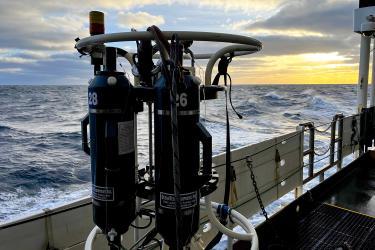
Despite it being important to better understand ocean acidification in the winter, it’s under-sampled across our region. The ocean is becoming more acidic as it absorbs more carbon dioxide from the air. Throughout this survey, we took measurements of dissolved inorganic carbon, total alkalinity, and pH to help estimate the rate of ocean acidification. We took these measurements at multiple depths between the surface and the bottom at several locations in the southern New England and Gulf of Maine regions. We also collected small, free-swimming marine snails called pteropods to measure how lower ocean pH is affecting their shells.
We sampled, day and night, to help set our environmental clocks. Measuring the temperature, salinity, nutrients, carbon, and acidity directly from the ocean gives us the most reliable data to estimate patterns throughout the water column, from the surface to the bottom. And, winter data provides us with an important starting point for the coming year.
That’s it for winter EcoMon 2024! This week at sea was an adventure!