
As a survey technician for NOAA’s Office of Marine and Aviation Operations, I’m permanently stationed aboard the NOAA Ship Henry B. Bigelow. The Bigelow typically sails around 180 to 200 days each year, conducting fisheries research missions. My role aboard the ship is to collect environmental data, operate and maintain acoustic sounders, assist scientists while aboard, and much more.
The science center’s Bottom Trawl Survey is my personal favorite project because it is critically important for the management of sustainable fisheries. This year marks the 60th anniversary of the Fall Bottom Trawl Survey—even more of a reason to celebrate! The Bottom Trawl Survey is conducted twice a year during the spring and fall. Each survey is about 60 days long. We’re constantly preparing for the next survey.
A Purpose-Built Ship
The Bigelow is particularly well-suited for survey operations: It was built to conduct fisheries research. It has abundant laboratory space, scientific equipment, berthing (where we sleep), and storage for the samples we collect. It can accommodate 15 scientists.

The Bigelow can also conduct advanced ocean floor mapping using:
- EM2040 multi-beam sounder, which maps the ocean floor
- ME70 and EK80 water column and bottom sounders, which measure the depth and contents of the water column (including fish)
- Acoustic doppler current profiler, which assists bridge operators with navigation and vessel speed prior to deploying sampling gear
In addition to the advanced hydrographic mapping hardware, the Bigelow also has an Olex survey and mapping system. This sophisticated sonar technology allows the officers and crew to see a high-resolution version of the ocean floor in three dimensions and in real time. By combining detailed ocean floor mapping data with the autotrawl system and fishing sensors deployed on the net, scientists and crew get a detailed view of exactly where the net is and how the gear is performing during each deployment.
Fish on Conveyor Belts
Once we complete a bottom trawl tow, we bring the net onto the ship and the contents, or catch, is placed into the checker. The checker is a large pen-like structure that feeds fish onto a system of conveyor belts. The conveyor system is custom-built to move fish through the wet lab for sorting and processing. In the lab, scientists will collect data, information, and samples on fish, including:
- Weight
- Length
- Sex
- Otoliths
- Fin samples
- Stomach contents
- Reproductive organs
We also collect other special samples for various scientific projects.
Collecting Oceanographic Information

We collect oceanographic samples at each station to generate a complete snapshot of the near-bottom ecosystem. Survey technicians are responsible for equipment maintenance, calibration, and operating oceanographic sampling aboard NOAA ships.
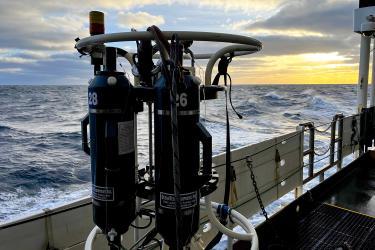
During this survey, our typical oceanographic operations include vertical conductivity, temperature, and depth, or CTD, casts at all sampling stations. The CTD is connected and powered by a fiber optic data cable and lowered to approximately 5 meters above the ocean floor. There the CTD will give us data on:
- Conductivity
- Temperature
- Depth
- Salinity
- Oxygen
- Light attenuation (light penetration in the water column)
- Chlorophyll concentration
Collecting Plankton Information
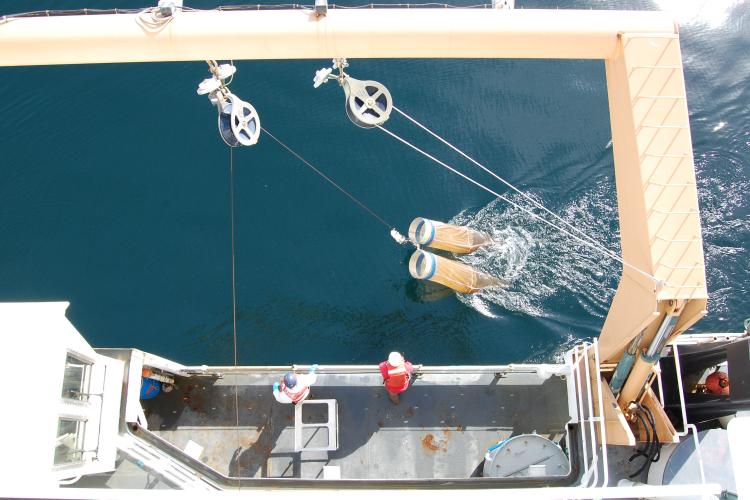
We conduct "bongo" plankton net tows at a subset of stations. The nets are made of a very fine mesh to collect zooplankton, tiny animals in the water column that are the base of the food chain. Scientists use these data to monitor marine ecosystems along the entire east coast of the United States. Fluctuations in the data can indicate changes in the environment.
Why We Do What We Do

The crew of the NOAA Ship Henry B. Bigelow have a deep passion and respect for the science center’s Bottom Trawl Survey because of its critical contribution to fisheries science in the region and the role we play in its success. The fish in the ocean are not unlimited and this survey has played an important role in understanding and monitoring fish stocks for the past 60 years. Data collected during this survey allows us to continue sustainably managing the nation’s marine life for future generations.