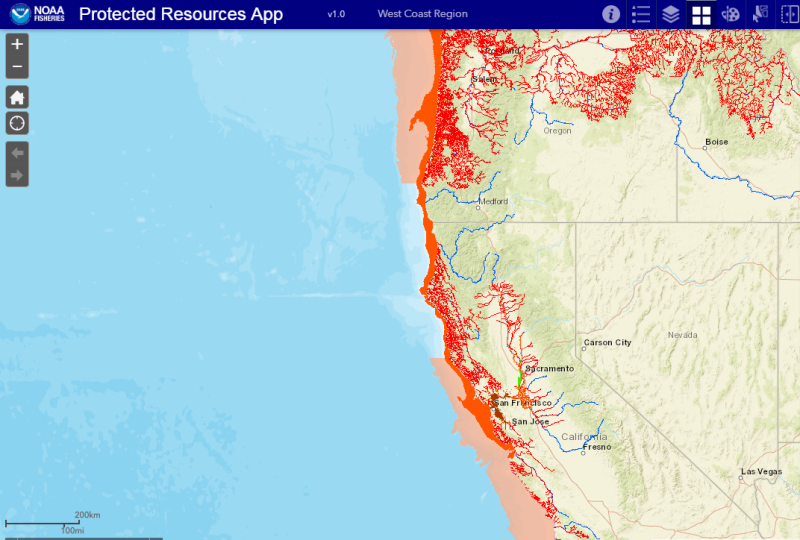
NOAA Fisheries has launched a new Protected Resources Application (app) that quickly and easily displays the locations of marine and anadromous species and their habitats protected under the Endangered Species Act (ESA).
The app draws on geographic information system (GIS) data, making it simple for the public, tribes, and government agencies, among others, to identify protected habitats. For example, users can easily create detailed maps comparing the habitat of different ESA-listed salmon and steelhead stocks and see where their habitats overlap.
Landowners can find out if their property contains ESA-designated critical habitat, grant applicants can focus and maximize habitat restoration proposals in areas where multiple protected species reside, and field biologists can decipher whether their geographic position is within a protected area by loading the app on any mobile device and using the “My Location” feature.
“This app provides a one-stop shop for NOAA Fisheries’ geospatial data throughout Washington, Idaho, Oregon, and California and along the coast,” said Scott Rumsey, Deputy Regional Administrator of NOAA Fisheries’ West Coast Region. “It helps organize and display mountains of data into something that is truly user-friendly. It will prove a valuable tool in helping to visually interpret NOAA Fisheries regulations and better understand how our sea turtles, marine mammals, and fish are distributed.”
In addition to NOAA Fisheries data, the app displays real-time data from external sources such as the U.S. Census Bureau, which provides congressional district and tribal boundary information. That helps keep data and spatial relationships current. NOAA Fisheries will continue to expand and update the app tools and incorporate new data.

Before this app, geographic data were available in many different formats and only accessible to those with specialized GIS software to open the files. Now, anyone with a computer and an internet connection can explore the data.
Use the Protected Species App in any web browser. Once in, click on the “Layers” icon to access and display datasets depicting different geographic areas. Users can draw on maps, for a truly customized experience, as well as share maps.

For more details about the app and how to use it, click the “About” tab within the app.