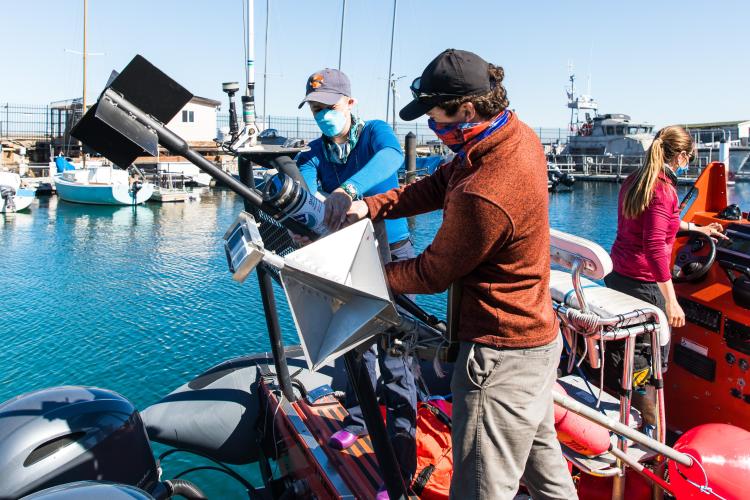
We need high quality acoustic data to study a variety of marine mammals that produce a huge range of sounds. In a previous Sound Bytes post, Cory described a low-frequency noise that interfered with her ability to detect fin whales in some of our archived recordings. Our team investigated the source of the noise in the lab, and suspected that the buoy movement in the water was causing the noise. We came up with a few ideas to reduce buoy movement underwater, and then Cory, Jack and I put them to the test in the open ocean of Monterey Bay. We were off to the races! Except this time instead of cheering for the fastest, we were all curious who would be the slowest, quietest buoy.
On Day 1 of the races, we tested three different surface configurations to compare how they moved through the water. Our original design has a tall metal radar reflector and giant red buoy. We suspected these features might catch the wind, act as sails and cause the buoy to speed through the water. The second design we call the "Ogger" because it was designed by the crab fisherman Dick Ogg (see Shannon’s blog). The Ogger had a smaller buoy and radar reflector. Our third buoy had a much lower profile, like a tortoise, which might make it slower and steadier than the others. We tracked the movement of the buoys by following their GPS trackers, which gave us position updates every 5 minutes. In the first 5 hours, the Ogger was in the lead, but all three buoys traveled an average of 0.25 miles per hour. This race is obviously not for speed!
On Day 2, we revisited each buoy in the morning to add bungies and underwater parachutes, which we call drogues. These additions should reduce movement through the water. Overall, we were thinking that less movement would produce less noise in our recordings. Would the parachutes slow the tall buoys down to tortoise speed? We left the buoys to drift for the rest of the day to find out.
While the buoys were drifting, we went out to look for whales. We found a few gray and humpback whales, and were able to take some photos. Although they’re not exactly glamor shots, these photos are very useful to researchers. Each individual can be recognized by the shape of their dorsal fin and markings on their body. We will share our photos with our partners at Cascadia Research Collective, who will look for matches in their photo-id catalogs. We also collected opportunistic acoustic recordings of Risso’s dolphins, which will be used to train machine learning algorithms. We really try to make the most out of our precious time on the water.
We ended the race as the wind was picking up and light fading on Day 2. The GPS tracks agreed. The low-profile buoy had the lowest average speed through the water, with and without the drogue. However, we know that this design is hard for passing ships to see, and has a higher risk to be hit and sunk. In addition to speed and visibility, next we will review the noise in the recordings to determine the official winner. With each iteration, our buoy design is improving. Better data means more information for science-based decision making and hopefully, better conservation outcomes for humans and the whales.
This work was conducted in the Monterey Bay National Marine Sanctuary under permit number MULTI-2019-005 and was funded in part by the Bureau of Ocean Energy Management and NOAA Fisheries’ Southwest Fisheries Science Center.


