Mooring Bonanza!
Our first mission is the highest priority, which is to deploy the Peggy surface mooring at the M2 site. Over the years, there have been eight ‘M’ sites, or Mooring sites, established as part of the EcoFOCI array in the Bering Sea. Today, M2, M4, M5, and M8 are active, but only M2 has surface moorings (some sites have multiple moorings). Peggy holds the most instrumentation of all the moorings, and is the poster child of this survey.

Fun Fact: The subsurface moorings can stay out year-round, while surface moorings have to be retrieved in October before the winter sea ice comes through. You may have guessed it—that’s one of the primary missions of the Fall Mooring Survey, along with swapping surface moorings with subsurface moorings that can remain out through the winter. Surface moorings like Peggy are extra valuable because they can measure conditions right at the surface of the ocean, and right above the surface. They can also transmit some data real-time back to our offices in Seattle.

Can you believe all the stuff that hangs below Peggy? There are a total of 18 temperature sensors (aka. SBEs in the diagram), which are positioned about every 3 meters (10’) from 1 meter below the surface (3.25’) down to 60 meters depth (197’). They collect oceanographic readings at least every hour, and some will collect conductivity, depth, and pressure measurements in addition to temperature. This string of instruments creates a comprehensive vertical profile of ocean conditions at the site.
You’ll also notice EcoFlourometers positioned at the surface, at 11 meters, 18 meters, and 44 meters down. These measure fluorescence in the water column, which is a reading of how much light a substance emits after it has absorbed light. These data provide insight into how much phytoplankton is present, which are basically microscopic plants that form the base of the marine food web. Other instruments along the mooring line collect readings on dissolved oxygen, carbon dioxide, the presence of nutrients, and how much sunlight is present at depth.

These data are part of the long-term EcoFOCI monitoring program that’s now 27 years running at this M2 site. And these sites, positioned across the Bering Sea Shelf, are critical for understanding changes in the Bering Sea. Observed changes could help explain other fluctuations we may be witnessing, such movements of fish or crab populations, seabird die-offs, salmon returns, and more. This information may also help us understand and document climate change.

Above is a map showing the overall working area for the 2022 Spring Mooring Survey. The orange circles and green diamonds are the oceanographic mooring sites. Along with the blue and yellow circles, which correspond to CTD and Bongo stations (more about those in the next blog), these form a line that follows the 70-meter isobath, a line where the depth stays at 70 meters. In general, to the west of that line, the seafloor is deeper, and to the east, it’s shallower.
Also of note relative to moorings are the blue diamonds, which are marine mammal mooring locations. These subsurface moorings have a much shorter mooring line, and they carry acoustic listening devices near the seafloor. Year round, they listen and record the marine soundscape. Once the moorings are retrieved, scientists can analyze the spectrograms (visual images of the sounds) to determine the presence of different species of marine mammals, including the endangered North Pacific right whale.

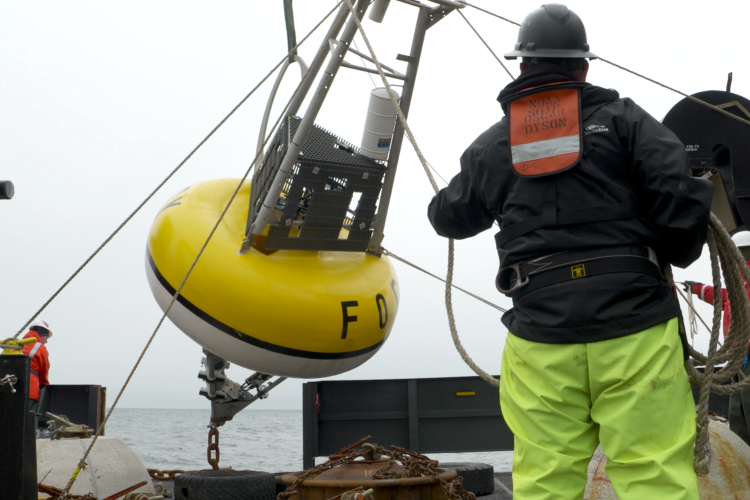
Fun Fact: How do you recover a subsurface buoy? Do you see that yellow cylinder just above the anchor in the photo? That’s an acoustic release. When onsite, scientists onboard the ship send an underwater acoustic signal to the release and it lets go of the mooring line. The buoy floats to the surface bringing all the instrumentation with it.

Everything is connected in the ocean. From temperature to salinity, to phytoplankton production and zooplankton (tiny planktonic animals) biomass, these attributes and organisms create the habitat conditions and food base for larger animals, which are often the ones we like to celebrate (whales, seals, polar bears, and seabirds) or eat (salmon, cod, halibut, crab, etc.). So, documenting oceanographic conditions is the foundation for our understanding of the ideal conditions in which these larger critters thrive as they feed, grow, and reproduce.
We mentioned a few things in that last paragraph that we haven’t covered much yet, including phytoplankton and zooplankton. How do we measure their production? Check out the next blog to find out!