Spring and summer begins the migration of belugas from the Bering Sea into the Chukchi and Beaufort seas, where they will feed, have babies (calves), and shed their skin (molt). Within the Aerial Surveys of Arctic Marine Mammals (ASAMM) study area, two separate stocks of belugas can be found: the Eastern Chukchi Sea (ECS) stock, which spends early summer in and around Kasegaluk Lagoon, and the Beaufort Sea (BS) stock, which spends early summer in the Mackenzie River Delta (Figure 1). During summer (July-August) and fall (September-October), the ASAMM project flies systematic line-transect surveys in the eastern Chukchi Sea and western Beaufort Sea in search of all marine mammals, including belugas. Beluga stocks cannot be differentiated using data collected solely from aerial surveys, but we know from satellite tag results that the ECS and BS stocks remain somewhat segregated in summer and overlap in the fall in the western Beaufort Sea (Hauser et al., 2014).

Figure 1. ASAMM study area, areas used by the Eastern Chukchi Sea and Beaufort Sea beluga stocks in early summer, and oceanographic features.
Since the early 1980s, the distribution and relative abundance of belugas have been tracked by the ASAMM project. These data show that the distribution of belugas within the western Beaufort Sea has remained remarkably similar, with belugas primarily distributed over the continental slope, regardless of season (Figure 2). Over the years in the northeastern Chukchi Sea, ASAMM has documented beluga distribution as more dynamic, with belugas in large groups near the coastline in summer (Figure 2A) and spread out across the area during fall (Figure 2B). In most years, belugas appear to follow some identifiable pathways, including the shelf break and Barrow Canyon.

Figure 2A.

Figure 2B. ASAMM beluga sightings, summer (A) and fall (B), 1982 through 2017.
In recent years, beluga distribution in summer has remained very similar to historical data (Figure 3A), but the whereabouts of belugas in fall have left ASAMM scientists and other researchers scratching their heads. In fall 2016, there were only 13 sightings of 21 belugas in the ASAMM study area despite survey effort comparable to previous years (Figure 3B; the symbols are larger so they can be more easily seen!). And, so far, in fall 2017, there have been only 2 sightings of 47 belugas. One of the sightings in fall 2017 was not on the continental slope, but, rather, close to shore. For comparison, during fall 1982-2015, on average we sighted hundreds of belugas for every 1000 km of survey effort flown. In contrast, during fall 2016 and from September to mid-October 2017, we sighted tens of belugas for every 1000 km of survey effort (Figure 4). Similarly low sighting rates were also recorded in fall 2008 and fall 2010, so the hideaway of belugas in fall is an ongoing mystery.

Figure 3A.

Figure 3B. ASAMM beluga sightings from 2016 and 2017, plotted over beluga sightings from 1982 to 2015, summer (A) and fall (B).

Figure 4. ASAMM beluga seasonal sighting rates for 1982-2015, 2016, and 2017 (thus far). “Tr SR” denotes the sighting rate on transect, defined as the number of belugas per km of transect surveyed.
If belugas were historically seen in the study area in fall and now they are not, where are they and what is driving this shift? One possibility is delayed migration. Data from belugas outfitted with satellite tracking devices and passive acoustic studies using underwater sound recording devices suggest that, in some years, the ECS stock of belugas delayed its fall migration out of the Beaufort Sea (Hauser et al., 2016). Similar data show that beluga distribution extends farther north beyond the ASAMM survey area. Maybe the majority of belugas in recent years are undertaking their fall migration farther north than ASAMM flies? This could reflect changes in the arctic ecosystem affecting beluga habitat and, ultimately, beluga distribution. For example, changes in the spatial and temporal distribution of sea ice may impact the distribution and density of beluga prey, which in turn could impact beluga behavior and distribution. Another hypothesis is that belugas could be taking evasive actions to avoid killer whales, who are known to be present in the ASAMM study area during the ice-free months of summer and fall.
Likely, no single data source will enlighten us, so we will have to rely on a suite of observational methods to solve the mystery of the disappearing belugas from the ASAMM study area in fall. Methods might include renewed efforts to tag belugas, placing passive acoustic recorders in deeper water farther north to pick up beluga calls, diet analysis, direct sampling of prey fish and oceanography in “typical” beluga habitat, and aerial survey data encompassing the eastern Beaufort Sea in addition to the current ASAMM study area. The challenge for researchers is to collect these data at the appropriate places and times so that the information can be used constructively to create a clearer picture of what is driving the observed - and unobserved - patterns in beluga distribution in the Pacific Arctic.

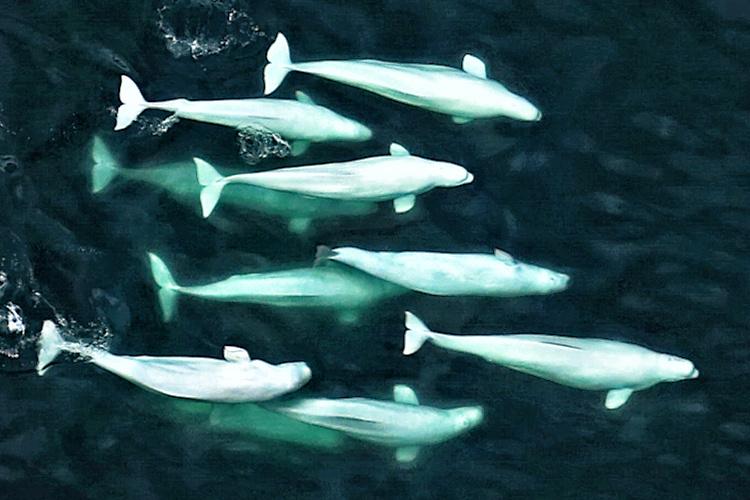
An aggregation of belugas sighted northeast of Utqiaġvik, Alaska, in July 2010.
Additional Resources
Meet the Blogger

Amy Willoughby is a marine mammal biologist at NOAA Fisheries’ Alaska Fisheries Science Center.
Amy began her career on the sandy beaches of Florida’s Atlantic coast where she conducted sea turtle nesting surveys. She took to the skies in 2009 as an aerial survey observer for the Florida Fish and Wildlife Conservation Commission’s North Atlantic right whale Early Warning System project.
Since then she has logged hundreds of flight hours searching for protected marine species in the Gulf of Mexico and coastal waters from New Jersey to South Carolina.
Amy has been involved in numerous field projects, conducting research on a range of species including salmon, marbled murrelets, bottlenose dolphins, ice-associated seals, and polar bears.
In 2014, Amy headed to the Alaskan Arctic for a seasonal position with the Aerial Surveys of Arctic Marine Mammals (ASAMM) project as a marine mammal observer and was fortunate to have the project invite her on as a full-time employee. Since then, she has worked for ASAMM year-round on fieldwork logistics, data management and analysis, and reports, and she serves as team leader and walrus data liaison during field operations.