Computer technology has had a huge impact in marine fisheries science, both in land-based labs and in field work at sea. Nowhere is that more evident than aboard fisheries resource surveys. Automating the way vessel sensor and biological data are recorded and saved during resource surveys has revolutionized data collection at sea.
In comparison to the manual data recording systems and paper logs of yesteryear, the fisheries scientific computer system (FSCS) used today on NOAA fishery survey ships is more cost effective, integrates biological and oceanographic data, reduces opportunities for errors, and provides audited data to researchers and managers within weeks, rather than months after a cruise.
“Everything is now tied together to the main system. We can tell what measuring board, at what station, and on what date a specific sample was taken,” said Paul Kostovick, an IT specialist in the NOAA Fisheries’ Northeast Fisheries Science Center’s Ecosystems Surveys Branch and one of the creators of the system. “Baskets with sorted species are all numbered and carefully tracked with bar codes. There are data and quality controls at each step in the process to avoid errors. It has significantly changed the way we conduct work at sea and made data collection so much easier and useful.”
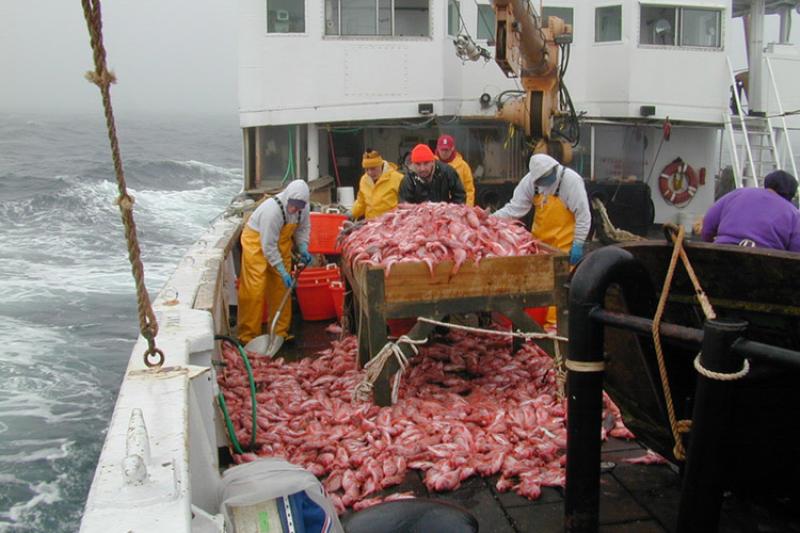
The NEFSC’s annual bottom trawl surveys sample at nearly 400 offshore locations each spring and fall. These surveys have been conducted since 1963 throughout the Northeast shelf from Virginia to the U.S. - Canada border.
For most of that time, the data were recorded manually on paper. Thousands of fish were sorted on deck by species, and researchers meticulously recorded by hand information about each fish, such as its sex, weight, length and stomach contents. After the survey, it then took months to process and make the data available to researchers.
In 1999, NOAA scientists began to focus on ways to upgrade from manual to digital data collection. This would result in the first version of FSCS, which was an extension of the scientific computing system already on the ships. Software engineers from NOAA’s Office of Marine and Aviation Operations (OMAO) partnered with scientists from NEFSC to find a way to automate fish data collection and integrate those data into the oceanographic and atmospheric data being recorded by multiple shipboard sensors. That real-time vessel data is useful to fisheries scientists in relating environmental conditions to biological data in particular surveys and over time.
“Compared to paper records, it was like night and day,” said Kostovick, who started at NOAA Fisheries as a biological technician on the surveys. He developed an interest in streamlining the data collection process at sea, in reducing errors and duplication, and saving time in processing reports after the cruise. “I really didn’t have the computer background but learned on the job.”
The FSCS system was further improved during the 2000s, and by 2011 it became a shared national standard database model for NOAA ships. The “FSCS 2.0” system is flexible enough to meet specific needs of a particular science center. In the Northeast, NEFSC researchers use FSCS 2.0 aboard the 209-foot NOAA Ships Henry B. Bigelow and Pisces, and the 72-foot research vessel Gloria Michelle. Massachusetts Division of Marine Fisheries use FSCS 2.0 on their spring and fall groundfish surveys on the Gloria Michelle, and also used the system on the 2016 industry-based Atlantic cod survey.
The FSCS 2.0 system was also recently installed for use on the 2017 sea scallop survey aboard the R/V Hugh R. Sharp, operated by the University of Delaware. Its flexibility also allowed a custom implementation for the Natural Resource Damage Assessment surveys conducted after the 2010 Deep Water Horizon oil spill in the Gulf of Mexico.