Social scientists at the Northeast Fisheries Science Center have found a new way to tame an old problem: how to put the data we collect into a form that’s relevant not only to fellow researchers, but also to a wider public.
“For years we’ve put out a lot of data on the health and well-being of fish stocks. Now we can put forth similar data for our commercial fishing fleets and communities, and our new tool makes it easy for anyone to see the results,” said John Walden, an economist in the science center’s Social Sciences Branch and a leader of the project.
While there are other places where similar kinds of data are already available, this is the first to aggregate the information by fishery management plan. Users can see the information in graphs and charts that render on demand and update annually, with options to download the data for use in other applications.
If We Can Picture Fish Populations, Why Not Fishing Fleets?
Economic data are only half of what’s available on the site. A related section displays a relatively new set of information that provides an index of just how “engaged” a port community is in commercial fishing.
“I think this site is the bee’s knees, but I deal with it every single day. For others, it is at the very least a step forward in making cultural information available at the community level, “ said Lisa Colburn, an anthropologist at the science center and also a principal in the site’s development.
To preserve business confidentiality, researchers can’t publicly report data for small communities with just a few dealers or vessels. Instead these data are combined with those from other nearby communities. “With an index, created with a range of inputs, you get an overall indicator that can be reported even for smaller places,” she said, “preserving that granularity and ensuring that the smaller places don’t ‘disappear’ from view.”
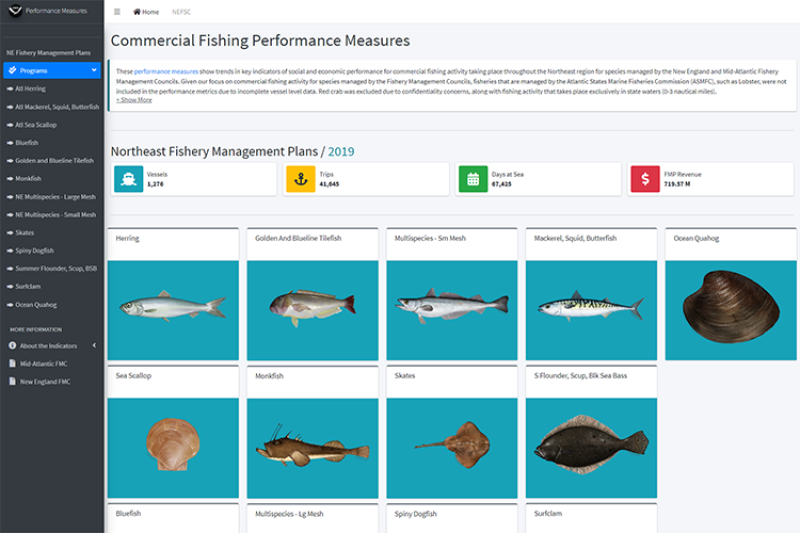
Performance Measures Tell the Tale
The site is organized around a series of “performance measures,” both social and economic, They are based on data gathered by researchers, through voluntary surveys, and in required reporting by fishing vessels.
Economic data presented on the site include numbers of vessels, trips, days spent at sea, revenues from first sale, prices, and something called the “Gini coefficient.” The Gini coefficient is a measure of how income, or revenue in this case, is distributed within a group. Higher values mean more concentration of revenue among fewer members of the group, in this case vessels operating within a fishery management plan.
On the social science side, the fishery engagement index measures commercial fishing importance in a community based on fishing activity. This is represented by permits, numbers of dealers, and vessel landings. A higher index value means more engagement.
Future Plans for Enrichment
Both Walden and Colburn hope to make even more data available on the site, enriching and expanding the picture of community and fleet well-being.
“Price indices would be one improvement,” said Walden, “especially examining how fuel prices have changed, since that is such a big input for the industry as far as cost. Profitability would be another good one. That’s more difficult because we need more cost information to cover all the different vessel types which are active in each fishery management plan, but we are working on that.”
Colleagues in the branch have been gathering cost information from vessel owners in a series of surveys since 2006, with the most recent in 2016. Another is planned for 2021, focusing on costs that are not collected elsewhere such as overhead costs, crew shares, mooring costs, and hull insurance.
Colburn, who is a leader in the national effort to develop indicators of fishing community vulnerability and resilience, also has plans for the future.
“One priority is to connect with the range of social indicators that we now develop nationally at a more aggregated level. These reflect community vulnerability and resilience when it comes to things like labor force characteristics, poverty , and gentrification pressure,” she said. The indicators are currently available for 4,600 communities in 23 states.
Programming for the site was the work of Tanya Noteva, a web development contractor who worked with the Social Sciences Branch from the initial design to the final product. “This project could not have succeeded without Tanya’s input, attention to detail and programming skills” according Walden.