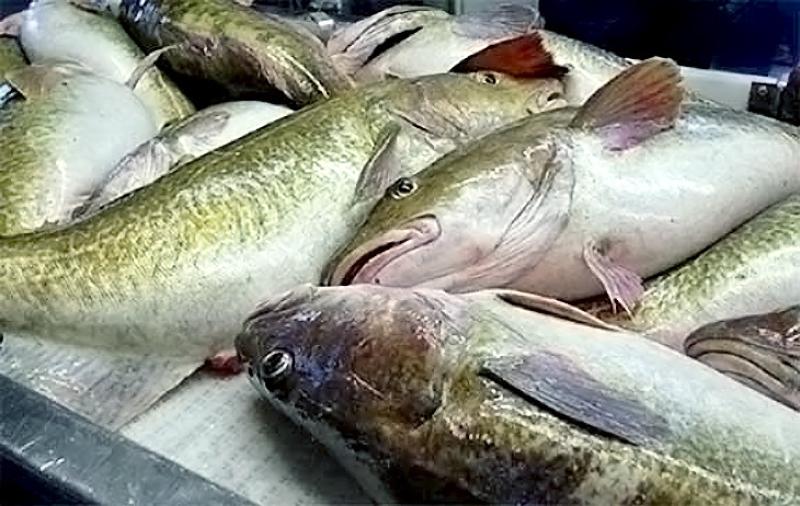
Pacific Cod, Gadus Macrocephalus, is the Second Largest Groundfish Fishery, Next to Walleye Pollock, in Alaska
(Fig. 1). In 2013, the Gulf of Alaska, Aleutian Islands, and eastern Bering Sea total catch was 318,867 metric tons with a gross value of nearly $390 million. Management of this important resource is conducted through stock assessments using age-structured models in which fish length-at-age data are key to estimating mortality, recruitment, and recommended harvest levels. Hence, the accuracy of fish age determination of Pacific cod is critical.
The reliability of Pacific cod age determination, however, has recently been called into question. An inconsistency has been identified between mean length-at-age from age-length samples taken in scientific surveys and the yearly progression of modal lengths representing some dominant cohorts (from the 1996 and 1999 year classes for example), specifically for Pacific cod that are 2 to 5 years old.

Figure 2. Pacific cod otoliths showing paired calcium carbonate structures located in the fish's inner ear.
Otoliths, which are used to determine the ages of fish, are paired calcium carbonate structures located in a fish’s inner ear in which annual growth rings (growth zones) are deposited (Fig. 2). Counting otolith growth zones to estimate fish age is analogous to counting tree rings. Unfortunately, however, compared with more than 30 other species aged each year by the Alaska Fisheries Science Center’s (AFSC) Age and Growth Program, age determination of Pacific cod is relatively difficult and sometimes uncertain. For some Pacific cod otoliths, multiple interpretations of growth zone patterns are possible, resulting in more than one potential age estimate per specimen (Fig. 3). Further, the precision of repeated otolith age readings is lower for Pacific cod than many other species. Therefore, in such problematic situations, a second independent method of estimating fish age is necessary to validate or confirm the fish’s age. In other species, a number of age validation methods have been used, such as bomb-produced radiocarbon, radiometric methods, or marginal increment analysis. But for a variety of reasons, these popular methods are not appropriate or have yet to be used for Pacific cod.

Figure 3. Transverse thin section of an otolith from a Pacific cod. The blue dots indicate translucent growth zones which were counted to estimate the fish’s age. The red dots indicate zones that were not counted, but represent alternative interpretations.
The Age and Growth Program recently initiated a novel alternative strategy to validate age determination methods and estimate ageing inaccuracy for Pacific cod. This approach to age validation relies on a geochemical technique using stable oxygen isotope signatures in otoliths. In marine carbonates, the δ18O concentration is typically inversely related to water temperature. Therefore, δ18O measured from the center to the edge of an otolith represents temperature changes over the fish’s life history and inversely mirrors annual seasonal temperature cycles. Counting the number of peaks in δ18O cycles (maxima) provides an alternative method for determining the fish’s age. Our primary goal was to use this alternate method to validate traditional Pacific cod growth zone-based ages and to estimate the probability of inaccurately ageing specimens. In the simplest sense, we compared the number of counted growth zones to the number of δ18O maxima. If the number of counted growth zones agreed with the number of δ18O maxima, strong support was given to the age determination methods (interpretation of growth zones) and estimated ages. A secondary goal was to describe the relationship between otolith δ18O and water temperature.
Study Design

Figure 4. Collection location of Pacific cod specimens in the eastern Bering Sea. Symbols represent age classes assigned by counting otolith growth zones during initial age determinations.
We used Pacific cod otoliths collected in the eastern Bering Sea (EBS) during AFSC assessment surveys conducted in 2006-2010 (Fig. 4). Prior to our study, specimens were aged for stock assessments by the break-and-bake method, the standard Pacific cod age determination method used at the AFSC. In this ageing method, otoliths are cut with a diamond saw transversely through the core and toasted in a small oven for about 5 minutes at about 400ᵒF. This preparation increased the contrast of translucent zones, dark zones thought to be deposited when winter temperatures are lowest, which were then counted. In the present study, the specimens were aged again independently by three additional age readers from the Age and Growth Program, resulting in a total of four sets of independent ages. On images photographed with a high resolution microscopy system, all readers recorded the location of each translucent growth zone they counted. We used Pacific cod 2 to 5 years of age due to the uncertainty of assigning ages to younger animals, and more specifically due to the mismatch between the mean size at age and modal length frequency progression. We randomly selected 40 Pacific cod specimens, each initially aged 2 to 5 years old, from the 2006-2010 surveys. Ten otoliths were taken from each age class, representing the 2004 and 2005 cohorts. This selection process based on age and cohort allowed us to evaluate age determination bias by estimated age.

Figure 5. Micromilling system: full Carpenter CM-2 system, and close up of micromilling stage and mounted otolith thin section.
To generate a δ18O signature representing the life of each fish, careful microscopic and analytical procedures were necessary, requiring specialized high-resolution sequential microsampling and stable isotope mass spectrometry tuned to small sample mass. Prior to sampling for isotopic analysis, the remaining intact otolith of each pair was thin-sectioned by embedding it in plastic resin and making two transverse cuts with a diamond saw. The resulting thin sections were mounted on glass slides and polished to a thickness of 0.7 mm (Fig. 3). Images of the thin sections were annotated to show the specific growth zones counted most recently by the three age readers. This required that locations of the earlier counted growth zones in the break-and-bake preparations were translated to the new thin-section images. Next, to carry out the high-resolution sequential microsampling, we used a Carpenter Systems CM-2® micromilling instrument. This computer-controlled system (Fig. 5) allowed progressive sampling which started at the inner most area of the thin section and advanced to the otolith’s edge (Fig. 6). Each progressive milling was about 40 µm wide, 900 μm long, and 250 µm deep and produced calcium carbonate powder with an average mass of about 30 µg. The micromilling provided up to 45 samples in any single otolith and up to 9 samples per postulated year. In collaboration with scientists in the College of Earth, Ocean, and Atmospheric Sciences at Oregon State University, the oxygen isotopic composition of the milled calcium carbonate powder was analyzed by dual-inlet mass spectrometry using a Kiel III carbonate preparation system connected to a MAT 252 mass spectrometer. Results were reported in standard delta notation (δ18O ‰) relative to Vienna Pee Dee Belemnite (VPDB).

Figure 6. Transverse thin section of an otolith from a Pacific cod. Top panel shows individual sampling paths (n=37) prior to micromilling. Each path has a width of about 40 μm. Lower panel shows the resulting trough after all samples have been milled.
Age validation requires comparisons of “true age” to the age estimated by the standard protocol of otolith growth zone interpretation and counting. To derive a true age, the δ18O signature of each otolith was first plotted sequentially by distance from the center of the thin-sectioned otolith to its edge. Next, the true age was determined by counting the periodic maxima in the sequence of δ18O measurements over the entire life span. Not entirely unexpected, some subjective interpretation of the δ18O results was necessary to define the periodic maxima. In doing so, the main considerations were 1) the variability (2 standard deviation (SD) error bars) of the δ18O data and whether the adjacent valleys and peaks were reasonably dissimilar (Fig. 7), and 2) if the peaks and valleys were defined by more than one δ18O data point. An offset between the location of potential annual growth zones and peaks in the isotope data may have existed. This is because the actual seasonality of growth zone deposition in the otolith may not have been understood correctly or because the spatial resolution of the milling may not have been high enough to avoid smoothing of theδ18O signal. Next, validation of the Pacific cod age determination methods was performed by comparing the number of δ18O maxima to the number of translucent growth zones originally counted in the break-and-bake otolith half. In total, 160 age estimates (4 independent readings x 40 otoliths) were compared to the true age for age validation and bias estimation.

Figure 7. Images of four Pacific cod otolith thin sections and associated δ18O results. The δ18O is plotted by distance milled, inner samples to outer edge. (Error bars are ± SD.) This demonstrates the correlation between the δ18O signature and the location of counted growth zones in the otolith cross sections. Green arrows (plots) and green lines (images) are the location of δ18O peaks; the red dots (images) and red arrows (plots) are the counted translucent growth zones. The scale bars are 2 mm.
Ageing bias, the difference between the growth-zone age and the true age, was estimated by two methods. Each method treated the age data differently. The first treated this difference as discrete and assumed a multinomial distribution. The second treated the difference as continuous and assumed a normal distribution. We employed both methods because previous studies have often estimated ageing bias and error by the latter method. Both approaches yield similar expressions of ageing bias, which quantify the probability of an age reader assigning an age equal to the true age or to some other age.
Our secondary goal required samples of otoliths paired with instrumental water temperature measurements. We used two sources of otoliths associated with known water temperature: 1) EBS and Gulf of Alaska adult Pacific cod that were collected during an archival (temperature and depth) tag-recapture study, and 2) juvenile (1-year-old) specimens collected in 2010 from the EBS.
In the first case, the otolith thin sections were sampled for δ18O on the edge, corresponding to the most recently deposited material, and paired with temperature measured by the tag. In the second case, the otolith thin sections were again sampled for δ18O on the edge, but for these specimens the temperature was measured at the time of capture by instruments mounted on the trawl survey nets. These sources provided a broad range of measured temperatures and hence the ability to describe its relationship with δ18O in the otolith.
Results & Conclusions

Figure 8. Probability of ageing bias, the difference between the growth zone-based age and true age, at each true age. A positive bias means an age older than the true age was assigned. A negative bias means an age less than the true age was assigned. Bars represent multinomial, solid line represents normal approximation.
Our primary goal of confirming the accuracy of the growth zone counts was largely achieved, and some guidance in choosing the best interpretation also was provided. The sequential δ18O measurements demonstrated clear seasonal signatures (Fig. 7) which made this validation possible. The percent agreement between the growth zone counts and the number of δ18O maxima was 61.18%, the average coefficient of variation was 8.04%, and the average percent error was 5.69%. Considering specimens individually, specifically the locations of counted translucent growth zones with respect to δ18O maxima, provided results in greater detail. For example, Figure 7 shows four images of thin-sections annotated with the counted growth zones and their respective δ18O signatures. In three of these examples, the number of counted growth zones is equal to the number of δ18O maxima. Further, the locations of the counted growth zones and the locations of the δ18O maxima in the thin sections are generally similar (Fig. 7). Therefore, this adds confidence to our age validation. In approximately 39% of the specimens, where the counted growth zones were not equal to the number of δ18O maxima, new guidance was provided for correct interpretation of problematic growth zone patterns. For example, we learned that a dark zone sometimes occurs inside the first true annual zone and should not be counted (Fig. 7). Also, a dark zone between the first and second true annual zones often occurs and should not be counted. This is clearly the case in panel 3 of Figure 7 where a dark zone was counted, but did not co-occur with a δ18O maxima. These examples can now be applied to future age estimates in Pacific cod.

Figure 9. Relationship between water temperature and δ18O in Pacific cod otoliths.
Bias estimation considered the difference between true ages and ages derived from growth zones interpretation in the break-and-bake otolith. It was rare for an age reader to assign an age 2 years greater or less than the true age. Hence, there was a very small probability of bias by that degree (Fig. 8). In general, both the discrete-multinomial and continuous-normal approaches to estimating the probability of bias were similar (Fig. 8). Over all ages, there was a 64% probability that an age reader assigned the true age, with a 19% and 17% probability of assigning an age less or greater than the true age by 1 year, respectively (Fig. 8). The probability of bias at the ages of 2 and 3 years was also relatively symmetric about ±0 years, and the different estimation methods showed similar results. At these ages, there was approximately an 80% probability of assigning the true age, and about a 10% probability of assigning within 1 year of the true age (Fig. 8). At the ages of 4 and 5 years, age-specific bias estimates were less symmetric about ±0 years and the different bias estimation methods had more discrepancies. At an age of 4 years with the discrete-multinomial approach, the probability of assigning an age equal to the true age was about 32%, to 1 year greater it was about 37%, and to 1 year less it was about 30%. In contrast, the continuous-normal approach showed a much greater probability (~62%) of assigning an age equal to the true age. Further, in this approach the probabilities of assigning an age 1 year greater or less than the true age were very unequal, about 36% and 8% respectively. At a true age of 5 years, the probabilities differed slightly between the two bias estimation methods. Both methods indicated a 50% to 60% probability of assigning an age equal to the true age. The probabilities in both methods were near 0% of assigning an age greater than the true age. However, the probabilities of assigning an age 1 year less than the true age were about 42% and 30% for the discrete-multinomial and continuous-normal approaches, respectively. Also, the discrete-multinomial approach indicated a small probability of under-ageing true age by 2 years (Fig. 8). While a comparison between the two estimation methods was instructive, we suggest that the discrete-multinomial approach was more faithful to the nature of age data.
The secondary goal of our research, to describe the relationship between otolith δ18O and water temperature, was very successful. The instrumental temperatures we had, whether measured at time of capture or from recording archival tags, demonstrated the strength of the relationship between δ18O in Pacific cod otoliths and water temperature (r2 = 0.74) (Fig. 9). In a related fish species, Atlantic cod (G. morhua), previous studies have also indicated that δ18O is a function of temperature.
The δ18O signatures indicated that the growth zone-based ages were usually correct, i.e. validated. When the number of δ18O maxima was not the same as growth zone-based ages, valuable insights were provided to aid interpretation of the growth zones. The confirmed relationship between otolith δ18O and water temperature lent credibility to this age validation study.