Hawaii’s bigeye tuna fishery effort has grown tremendously over the past 20 years, so how does that affect its catch? Oceanographers from NOAA’s Pacific Islands Fisheries Science Center and the University of Hawaiʻi examined logbook, observer, and ocean temperature data from 1995 to 2015. They found that fish catch doesn’t just depend on how many hooks are set, but also where those hooks are set. Why?
The number of hooks set annually by the bigeye tuna fishery in Hawaiʻi has grown five-fold (from 8 million to 47 million hooks!). Not only are they setting more hooks, but they’re setting them over a larger area. In the mid-1990s, nearly all of the bigeye fleet operated in the southern area around Hawaiʻi. Now, more than 40 percent of the fishery’s operations are northeast of Hawaiʻi.

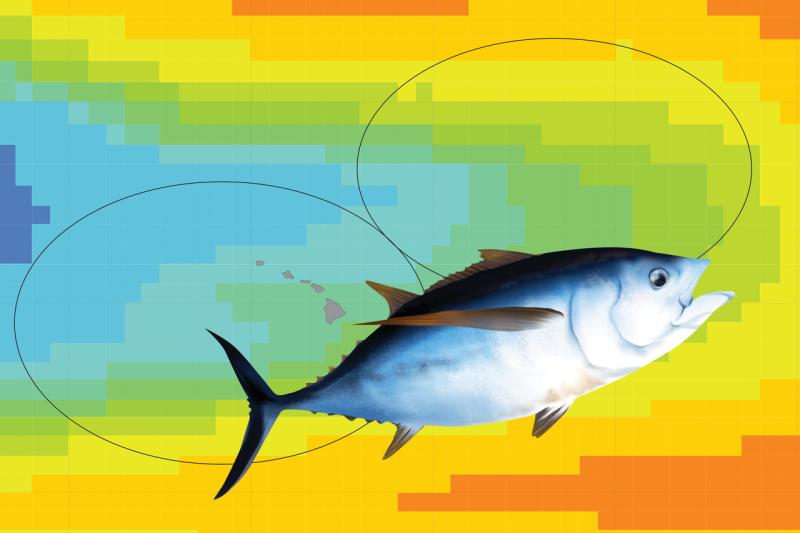
Map showing the fishing grounds for Hawaii’s bigeye tuna fleet. The circles show the areas of most fishing effort in the mid-1990s (around Hawaiʻi) and more recent years (northeast of Hawaiʻi). The coloring shows the average depth of waters between 8 and 14 °C (46 and 57 °F), preferred by bigeye tuna during the daytime.
Over time, two things have stayed pretty much the same in this fishery: the boats set their fishing hooks at the same depth, and the fish prefer the same daytime water temperatures. Researchers found that the preferred water temperatures and the fishing depth overlap by different amounts in different areas. Near Hawaiʻi, preferred temperatures are deeper, so fishing gear only overlaps slightly. Northeast of Hawaiʻi, where the preferred temperatures are closer to the surface, they overlap almost completely. Fishermen northeast of Hawaiʻi are setting their hooks exactly where the bigeye tuna like to spend their day, leading to higher catch rates in that area.

Bigeye tuna lined up at the Honolulu fish auction (Photo: NOAA Fisheries/Justin Hospital).
This helps explain why bigeye tuna catch rates have been increasing for the past few years. Higher catch rates help explain why the fishery has not only expanded its effort, but also expanded its location. Fisheries put more fishing effort in waters where catch rates are higher.

Bigeye tuna catch rates, measured as number of bigeye tuna caught per 1,000 hooks set.
Studies like this one improve fishery managers’ understanding of fishery trends. Understanding how catch varies as a result of fishing effort, fleet movement, and oceanography can lead to more informed fishery management decisions and a more efficient, resilient, and cost-effective fishery.
Read more: Synergy among oceanographic variability, fishery expansion, and longline catch composition in the central North Pacific Ocean (published in Fishery Bulletin).