During this year's Eastern Bering Sea and Northern Bering Sea Bottom Trawl Surveys we are collecting and sharing near-real time temperature data from the ocean seafloor.
The goal of the survey is to collect data on the distribution and abundance of crab, groundfish, and other bottom-dwelling species in the eastern Bering Sea. These data are used for ecosystem monitoring and to estimate population abundances to aid in the management of commercially important species in Alaska. NOAA Fisheries has conducted this survey annually since 1975 but was canceled in 2020 due to the COVID-19 pandemic.

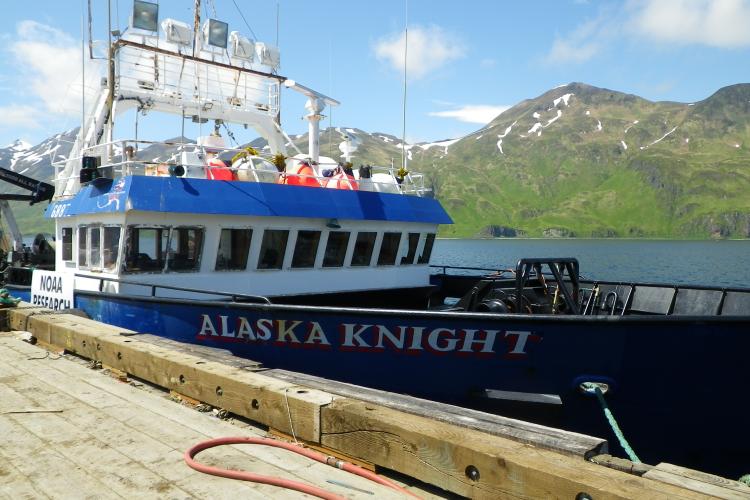
The survey is operating somewhat differently in 2021. This year, start dates are staggered for the two vessels conducting the survey, the FV Vesteraalen (departing Dutch Harbor on 27 May) and the FV Alaska Knight (departing Dutch Harbor on 30 May), and port calls are minimized. For the safety of our crews and the communities of Alaska, we have also canceled outreach events typically associated with our port calls during the survey. However, as in recent years, we intend to provide regular survey updates on water temperatures collected near the seafloor at all of our survey stations. When we conduct surveys for fish and other species, we also collect information about the environment in which they live—their habitat. For fish and other species water temperature is important. It affects their spawning, access to food, growth rates, and their overall distribution patterns.
Survey Leg 4: August 5 - August 16, 2021

Animated grid map of the northern Bering Sea survey area displaying leg 4 daily color coded bottom temperature readings from August 5 through August 16, 2021. Credit: NOAA Fisheries.
Survey Leg 3: July 12 - August 4, 2021

Animated grid map of the eastern Bering Sea survey area displaying leg 3 daily color coded bottom temperature readings from July 12 through August 4, 2021. Credit: NOAA Fisheries.
Survey Leg 2: June 19 - July 10, 2021

Animated grid map of the eastern Bering Sea survey area displaying leg 2 daily color coded bottom temperature readings from June 19 through July 10, 2021. Credit: NOAA Fisheries.
Survey Leg 1: May 31 - June 20, 2021

Animated grid map of the eastern Bering Sea leg 1 survey area displaying leg 1 daily color coded bottom temperature readings from May 31 through June 20, 2021. Credit: NOAA Fisheries.
Concerns remain regarding overall water temperature and the overall extent of the cold pool. While winter sea ice coverage was better in 2020 and 2021 than in recent years, increased coverage in 2020-2021 follows the record low coverage observed in 2017-2019. The cold pool is a natural, thermal barrier created by winter sea ice and it persists throughout the subsequent summer over the eastern Bering Sea shelf. It tends to separate Arctic species, usually found in the northern Bering Sea, from commercially important stocks of walleye pollock, Pacific cod, and other species typically found in the eastern Bering Sea. The cold pool was greatly reduced during the summers of 2017-2019, and fish distribution patterns changed profoundly, with significant proportions of the walleye pollock and Pacific cod stocks observed in the northern Bering Sea.
Once scientists complete this year’s survey of the eastern Bering Sea, they will move northward to conduct a full survey of the northern Bering Sea bottom-dwelling community. Additional surveys are planned in the northern Bering Sea using surface trawls and hydro-acoustics to monitor key components of the marine ecosystem and environmental conditions. Be sure to check back here for regular updates on ocean temperatures collected during the Bering Sea bottom trawl surveys.
The eastern Bering Sea bottom trawl survey is being conducted from approximately May 27 to August 4. The northern Bering Sea bottom trawl survey will be conducted from about August 4 to 16.