“So much of the seafloor has never been mapped,” said Tim Battista, a scientist with NOAA’s National Ocean Service. “And in the areas that have been mapped, the data is often so sparse that it’s difficult to know what’s down there.”
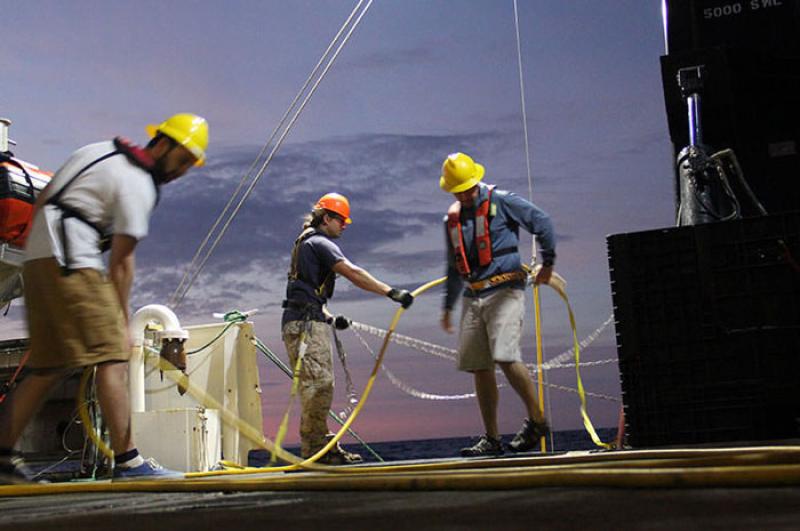
Battista just returned from an 11-day expedition to the Caribbean, where he and other scientists aboard the NOAA Ship Nancy Foster mapped the seafloor around the Island of St. Croix. They are producing the first high-resolution bathymetric and habitat maps of the area.
In the old days, sailors would map the seafloor by dropping a plumb line to the bottom to measure depth. Onboard the Nancy Foster, scientists plumbed the seafloor with pings of sound from a multi-beam sonar system—1500 of them per second. The time it takes each ping to return indicates the depth at a single point on the bottom, which then becomes a pixel on the bathymetric map.
It is difficult to determine the seafloor habitat types directly from the sonar data, however, so scientists are also deploying remotely operated vehicles with video cameras attached. “The ROVs give us eyes on the bottom,” Battista said. That allows scientists to map habitats, including the coral habitats favored by snappers, groupers, and other valuable fish species.
They’re also using scientific fish finding sonars that can pick up things in the water column as small as diatoms and as large as marine mammals. The result is a three-dimensional living map of the ocean that shows the shape of the seafloor, the habitats that cover it, and the animals that occupy the space above.
Maps Used to Design Fish Surveys
One of the people using those maps is Matt Campbell, a biologist with NOAA’s Southeast Fisheries Science Center who works on surveys to estimate the number of reef fish in the Gulf of Mexico and Caribbean.To estimate the abundance of reef fish, Campbell and his team drop a camera pod onto reefs to see who’s down there and to evaluate what kind of habitat they are utilizing.
The pod is about four feet across and has four cameras, each pointing in a different direction. “It looks like a giant hockey puck,” Campbell said. Because the cameras produce stereo video, scientists can not only identify and count fish, they can also estimate their size.
But knowing where to drop the cameras is difficult when you don’t have appropriate maps. “We’re interested in reef fish,” Campbell said. “So first we have to find the reefs.”
Most of the bottom, however, is sand, and in the past, dropping the camera involved a lot of guesswork. Campbell will use the new maps from the Nancy Foster expedition to drop the camera pod in places where he’s more likely to get fish on tape.
The reefs they’re looking for are not the shallow water ones you might see on your Caribbean vacation. They’re looking for mesophotic coral reefs, which live in semi-darkness at depths of up to 150 meters. “Those corals are beyond the safe range for divers,” Campbell said. “That’s why we know so little about where they are.”
In addition to feeding into fish surveys, the map data produced by the recent expedition will be used for navigational charts and for designing protected areas for fish.
“The vast majority of the ocean is unmapped,” Battista said. “But where we do make the effort to look and listen, it’s amazing how much we can see.”